Visualizing healthcare quality trends in Texas Medicaid
Small-multiple and bubble charts of potentially preventable admissions, visits and readmissions across Texas Medicaid service areas, prepared for the 2024 Texas Quality Forum.
Project figure
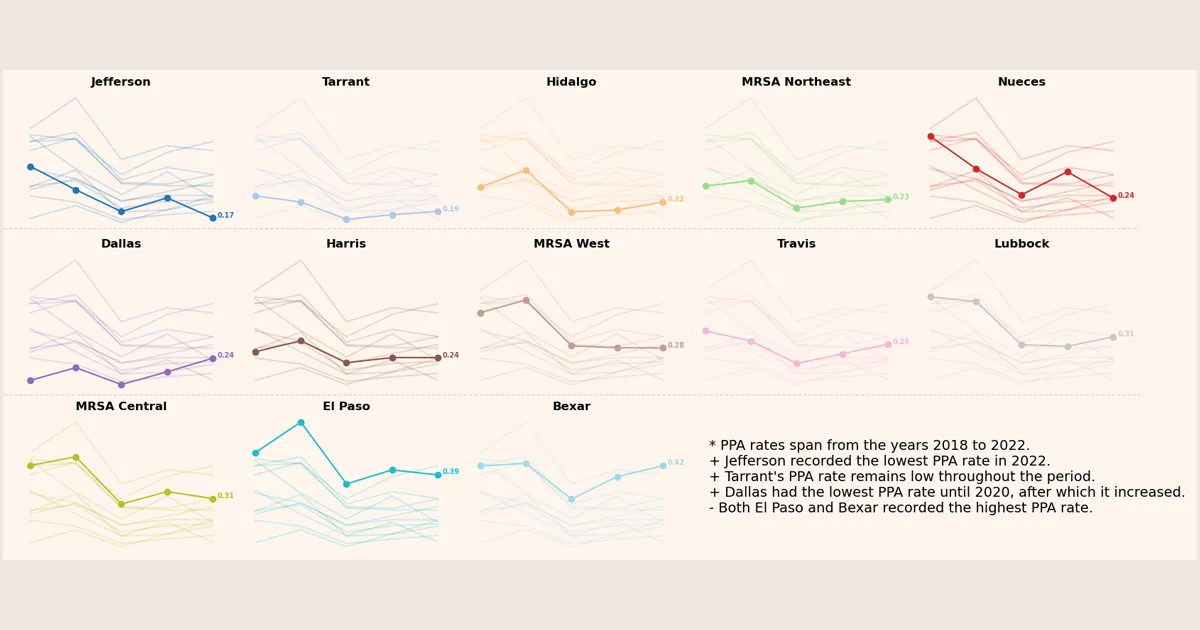
Potentially preventable admissions by service area, 2018 to 2022
Made in Python for the 2024 Texas Quality Forum from Texas Medicaid potentially preventable event rates.
Quality measurement in Medicaid produces many rates across many places and years. The aim of these figures, made in Python for the 2024 Texas Quality Forum, was to let a reader find one service area quickly and see it in the context of all the others.
Five-year trends by service area
The figure above follows potentially preventable admissions (PPA) in Texas Medicaid from 2018 to 2022. PPA is one of the potentially preventable event measures developed by 3M; a lower rate reflects better management of chronic conditions and prevention of severe illness.
Each panel highlights one service area and shows the others in light gray behind it, so a reader can compare one area with the state without reading thirteen overlapping lines. Each point is one year, and panels are ordered by the 2022 rate, lowest first.
- Most service areas moved downward over the five years.
- Jefferson had the lowest PPA rate in 2022.
- Dallas rose after 2020.
- El Paso and Bexar had the highest rates.
Three measures at once
Project figure
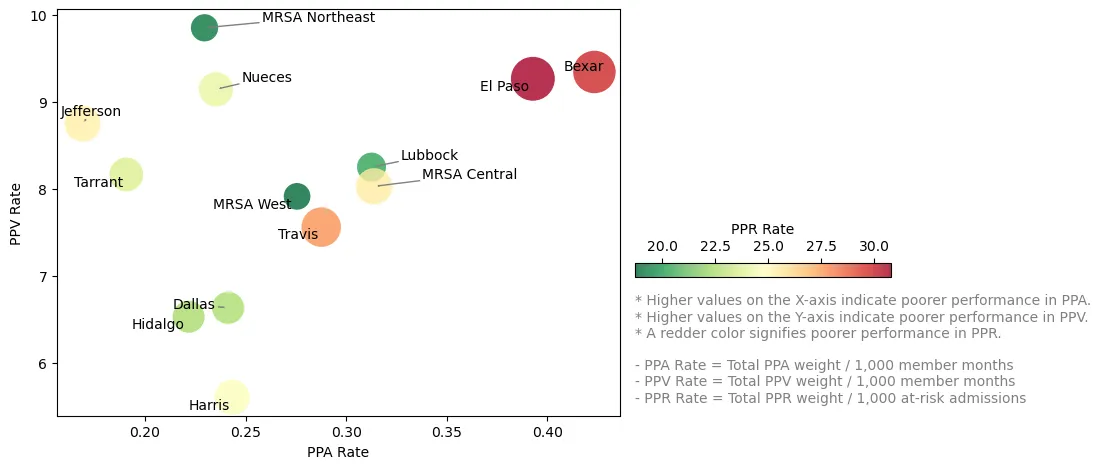
Three preventable-event measures by service area, 2022
Made in Python for the 2024 Texas Quality Forum. Bubble size and color both show the readmission rate.
The second figure places each service area by its 2022 rates of potentially preventable admissions (PPA) and visits (PPV), with potentially preventable readmissions (PPR) shown by bubble size. Because differences in bubble size are hard to judge, color repeats the PPR value; redder bubbles mean higher readmission rates. Higher values on all three measures indicate worse performance.
- El Paso and Bexar sit toward the upper right, with higher rates on all three measures.
- MRSA Northeast did well on PPR and PPA but had the highest PPV, which points to outpatient care.
- Dallas, Hidalgo and Harris had lower rates across all three.
Design notes
Small multiples work here because the question is comparative: “how is my area doing relative to the rest?” Highlighting one line per panel keeps that comparison readable, and sorting panels by the latest value turns the grid into a ranking without a separate table. Redundant encoding (size and color) in the bubble chart is a deliberate trade: it costs a legend entry and saves the reader from comparing areas of circles.
First published on my earlier site, andeeli.github.io/posts/visulation-24-quality-forum/, and revised for this one.